Financial news is buzzing this morning as a result of the 10-year Treasury yield briefly trading below that of the 2-year treasury, a phenomenon, known as ‘inversion’. A sustained inversion is often considered an early warning signal around the strength of the economy and potential for recession. The simplicity and irregularity of this if/then relationship makes for enticing media sound bites that may cause confusion regarding the immediacy of recession.
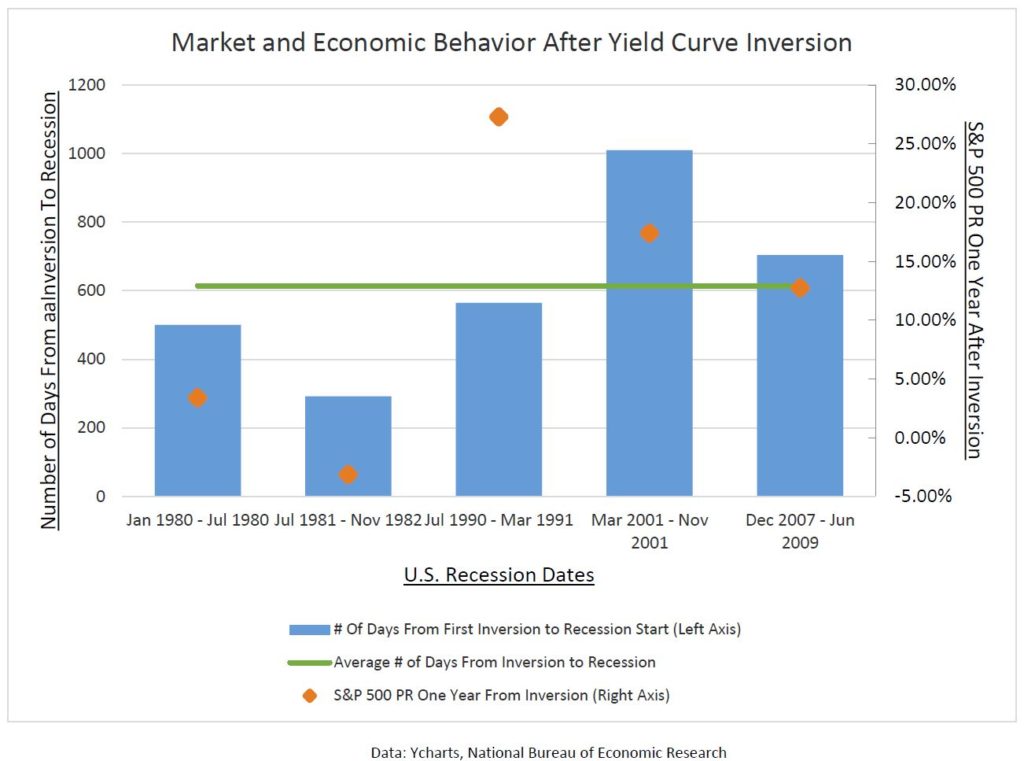
To help add clarity, we constructed a chart that outlines the lag between yield inversion and the peak of an economic cycle (blue bar, left axis) along with stock market performance (orange dot, right axis):

As of this writing, the yield curve is no longer inverted, but nonetheless, will surely be discussed in media. As wealth managers, we consider this one reference point in a sea of data and, as always, encourage well-reasoned decisions rather than irrational or impulsive reaction around any single metric.


