Mid-October in the Northeast is often accompanied by colorful panoramic displays of fall foliage, crisp morning air that gives way to warm afternoons and the occasional smell of an evening fire stoking in a hearth. However, every four years the senses are often overloaded by a different mid-October tradition, the sudden visual and audible inundation of political rhetoric and commentary leading up to the Presidential election.
Often candidates’ debate the merit and superiority of their policy designs while an endless stream of political pundits take to the airwaves. There are frequent articles written regarding the potential impact all the election angst could have on investors and financial markets. Fortunately, by looking back at the history of Presidential election cycles we can separate the facts from the noise of these daily prognosticators.
Since 1928, the year the S&P 500 began, we have experienced 22 Presidential election cycles. During these election years the S&P 500 has finished the year with positive returns 82% of time, with an average annual return of 9.8%. For comparison, in all years since 1928, the S&P 500 has ended the year with positive returns 74% of the time with an average annual return of 9.7%. Additionally, it is worth noting that about one-third of all the negative years the S&P has experienced occurred between 1929 and 1945, years that included both the Great Depression and World War II.
| Presidential Election Years (1928-2012) |
| Number of Elections: | 22 |
| Number of Years S&P Positive: | 18 |
| Election Years S&P Was Positive (%): | 82.0% |
| Geo. Average Annual Return: | 9.8% |
| S&P Returns (1928-2015) |
| Number of Years S&P Positive: | 65 |
| Number of Years S&P Negative: | 23 |
| Years S&P Positive (%): | 74.0% |
| Geo Average Annual Return: | 9.7% |
Moreover, when looking at S&P 500 perfomance in the year following a Presidential election, we see a similar pattern of rising stock prices. Of the 22 post-election years, the S&P 500 has experiences positive returns 68% of the time with an average annual return of 11.0%.
| S&P Performance in Year Following |
| Presidential Election (1929-2013) |
| Number of Occurrences: | 22 |
| Number of Years S&P
Positive: | 15 37 |
| Years S&P Was Positive (%) | 68.0% |
| Geo. Average Annual Return: | 11.0% |
Lastly, when evaluating S&P 500 performance over a President’s full-term in office we have only seen three occurrences of negative cumulative stock market returns. The President’s that presided over these terms were Herbert Hoover, Richard Nixon, and George W. Bush.
S&P 500 Performance by President
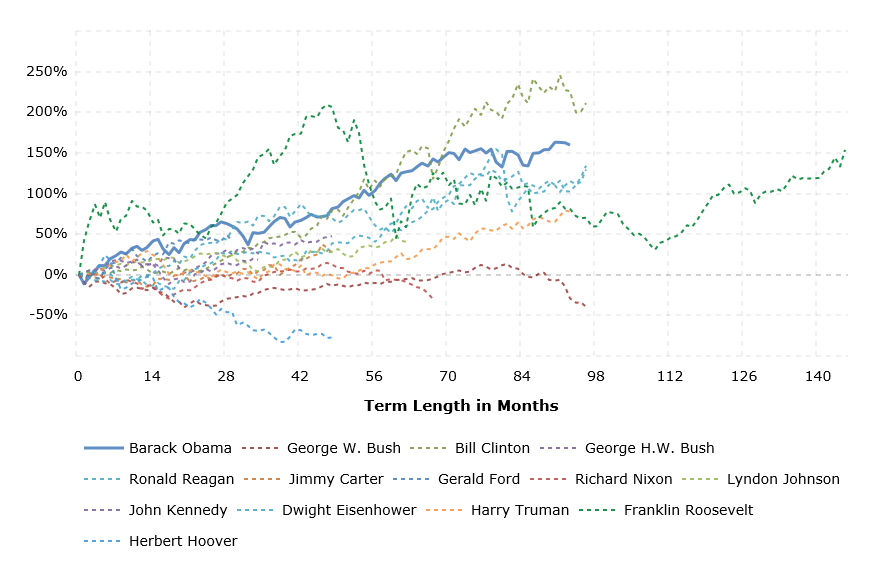
Chart Courtesy of macrotrends.net
The factors that contributed to negative stock market performance vary by President. The 1920’s, often referred to as ‘The Roaring Twenties’, was a time fueled by post World War I optimism. This led to a rapid expansion in stock prices against a weakening economic backdrop. All of this culminated in the stock market crash of October 1929, seven months after Hoover took office, and the subsequent economic depression. For the next decade politicians would try many measures, with varying degrees of success, to right the economy but ultimately it wasn’t until World War II that the American economy was revitalized.
More recently, many can recall the ‘dot com’ bubble of the late 1990’s. Over a five-year period stock prices rose between 200-300%, depending on the index referenced, fueled largely by speculation that pushed company valuations to extreme excess over their fair values. At the same time, homeownership rates began to rise rapidly before peaking in 2004. Subsequently, the stock market bubble popped in August 2000 and the value of the S&P 500 would fall nearly -12% by Bush’s Inauguration date in 2001. One month into Bush’s first-term the U.S. economy officially entered recession. Stock prices would continue to fall, bottoming at nearly -50% from their August 2000 peak in 2002, and then recover over much of the remaining term until mid-2007. At this time, steadily rising defaults brought about by the rapid expansion in first and second home ownership, fueled in part by relaxed lending standards, began to make their impact felt on both the economy and financial system. Bush’s term would end in the midst of the “Great Recession’.
Both of these scenarios highlight two significant modern economic crises’ in our nation’s history. Under both it is important to recognize the contribution third party variables had on the economy and financial markets rather than Presidential policy alone. While it is true that Presidential policies influence the country’s path it can often take years for their economic impact to be felt. Often there is adequate time for capital markets to adjust and business cycles to adapt. However, this does not mean financial markets are immune to bouts of short-term volatility, as was witnessed in June with the United Kingdom referendum to withdraw from the European Union (Brexit). At the time it was deemed only a low probability that the outcome of the vote would be in favor of a Brexit, however, in the end, this was indeed the result of the referendum. This political decision, with large scale economic consequences, caught many by surprise and sparked weeks of stock market volatility before ultimately recovering.
As we continue to move towards November we can be confident hours of daylight will continue to shrink and political theatre will expand. But regardless of this election’s outcome the stock market performance of the President-elect will most likely be at the mercy of the business cycle. While there is always the chance an historical event could cause disappointment, the overwhelming majority of Presidents have enjoyed rising stock prices over their terms regardless of what campaigned political policies they are actually able pursue.