
The U.S. – China trade dispute has developed into something akin to a bad cold- lingering and remediless.
The folks at Statista, a statistics database, put together a great chart illustrating the key dates of tariffs imposed since 2018. We looked at how markets behaved around those announcement dates, which we summarized in the chart below:
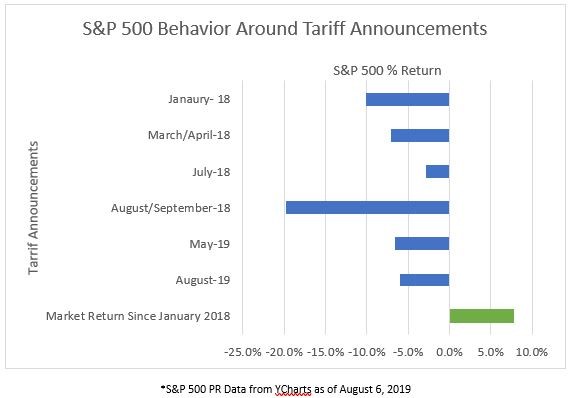
It illustrates that the past few days have been fairly consistent with behavior around other tariff announcements. We should note, the August/September 2018 decline was likely exacerbated by monetary policy comments made by the Federal Reserve.
Thus far, these setbacks have been relatively temporary with the market boasting positive returns over the period. For most investors, normal market fluctuations shouldn’t be a catalyst for change in investment approach, unless of course there has been a change to your financial situation or investment objectives.